Management
KPIs continuously
Order intake, backlog, margin and cash in dashboards that keep themselves current, instead of in different versions.
How you work it in Colleag
- 1
Choose the KPIs with the colleague.
- 2
The colleague builds the dashboard against the business system.
- 3
Review: right measures, right periods, right thresholds.
- 4
One truth for the management team, continuously updated.
A worked example
“Build a management dashboard with order intake, backlog, margin and cash.”
A dashboard with the measures from the business system, trend and comparison periods, updating continuously. Everyone in management sees the same figure, and the question of whose version applies disappears.
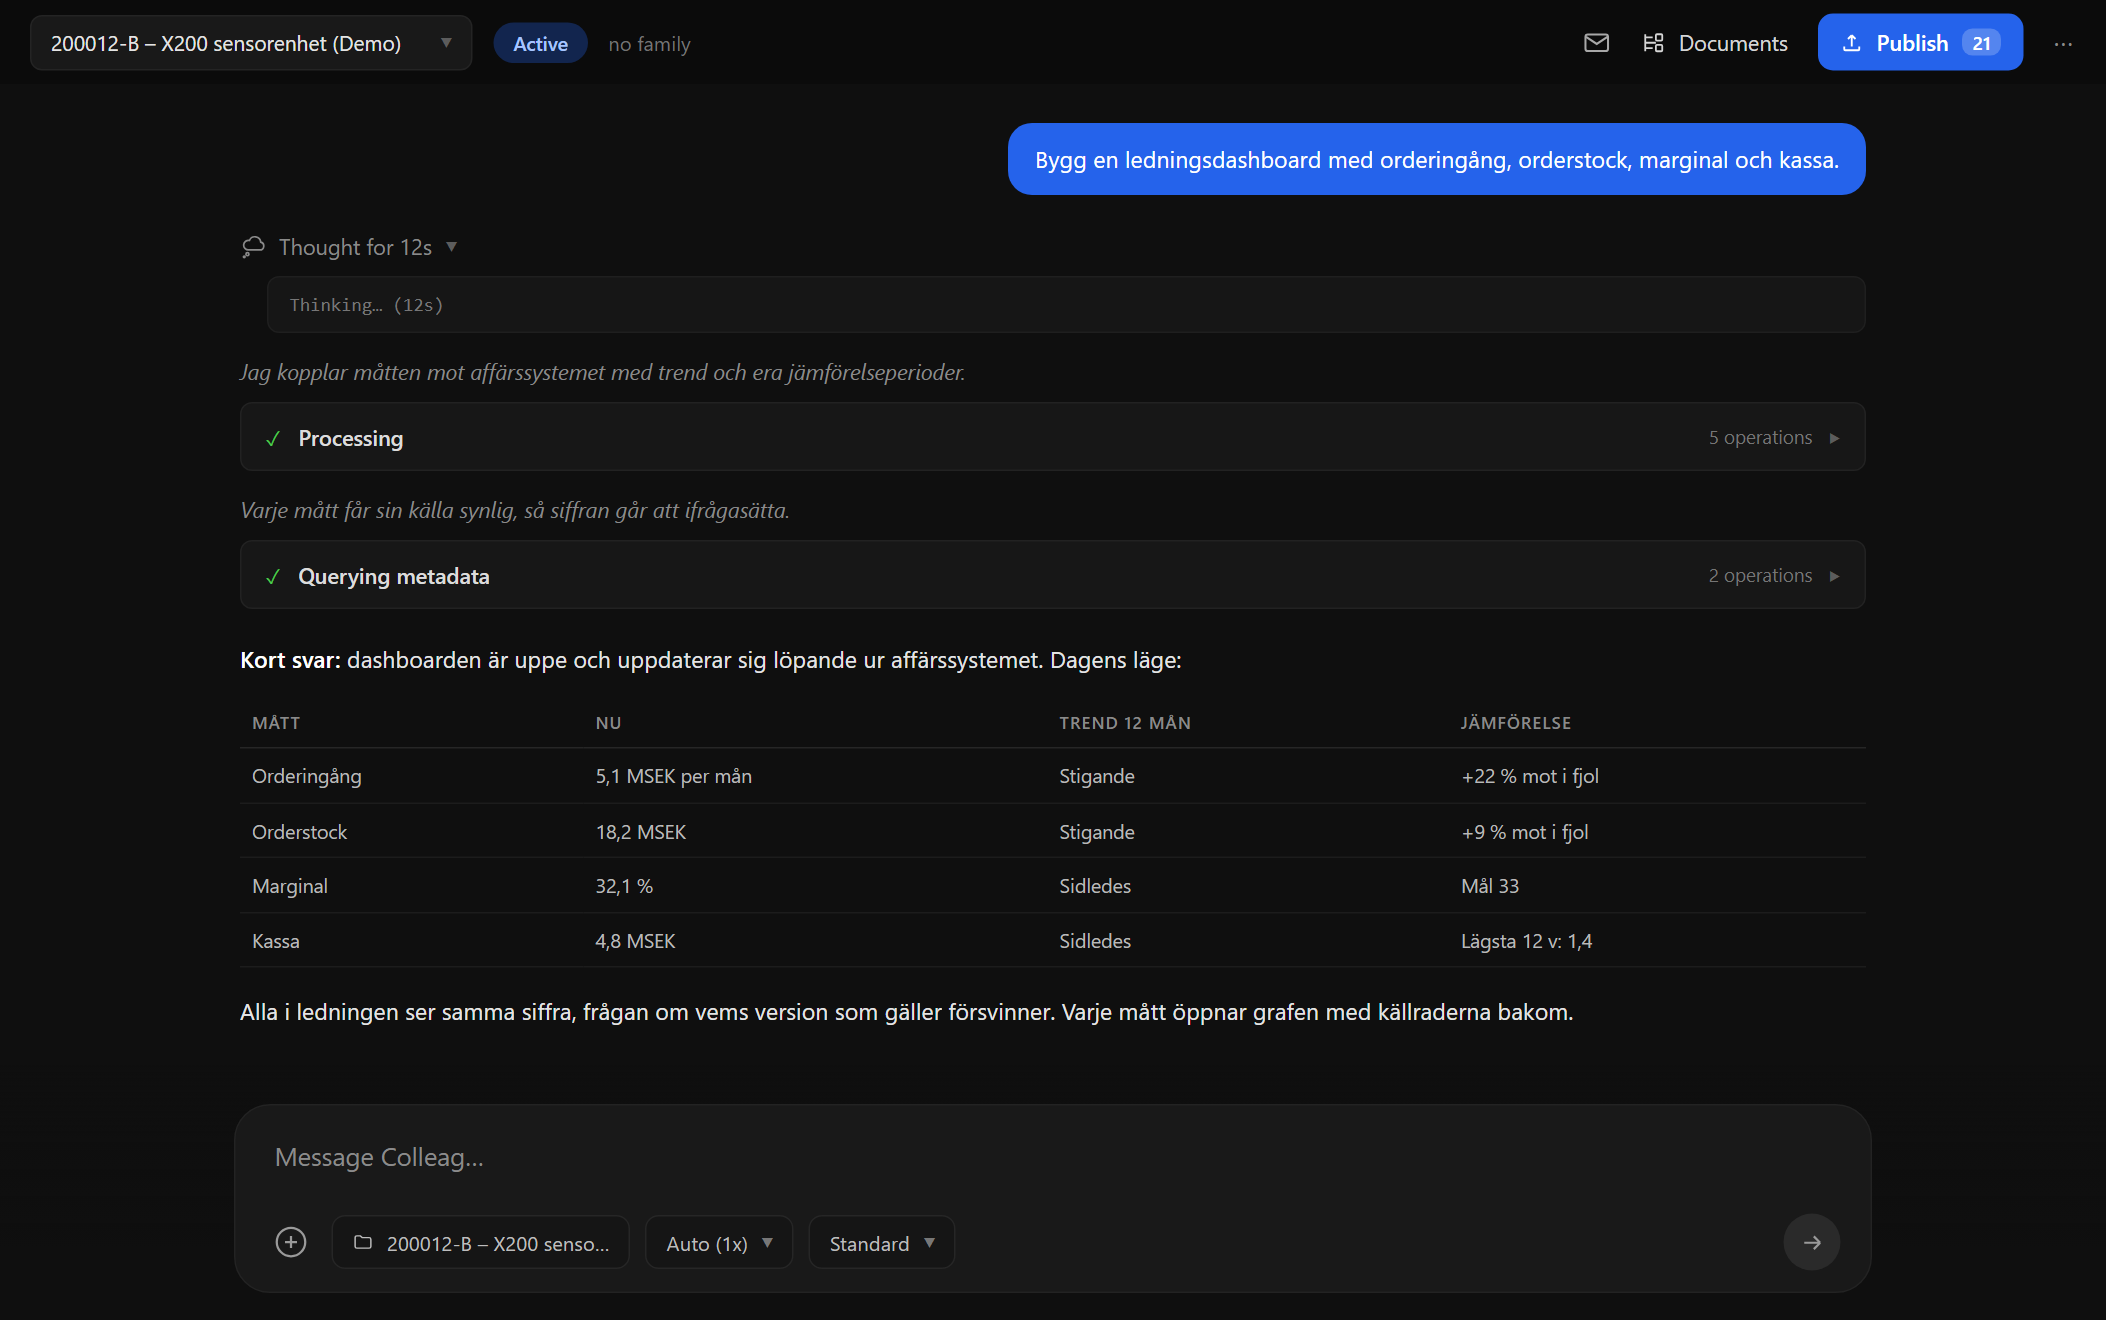
Screenshot from Colleag. The example uses invented figures.
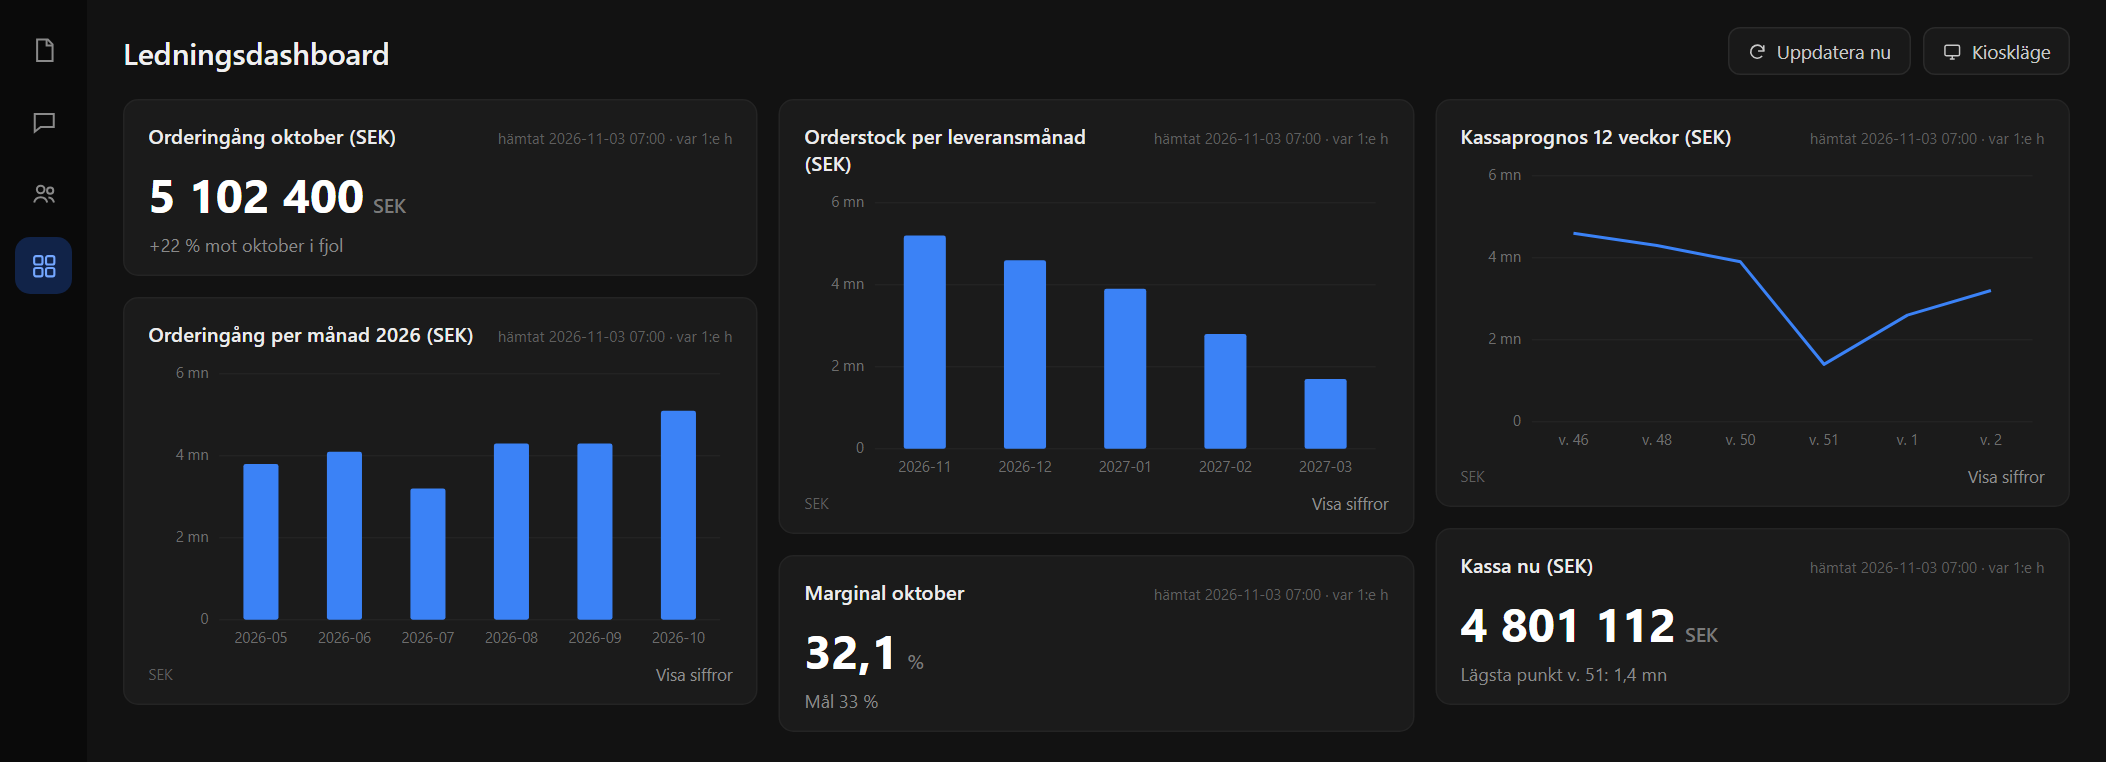
The dashboard from the example, on its own screen or in kiosk mode. Invented figures.
The material
- Order intake and backlog
- Margin and cash data
- Your chosen comparison periods
You approve
Everything the colleague produces is a proposal with sources. Nothing is published, sent or saved to the archive without a human approving it, and every figure traces to its material.
More from Management
Curious what it feels like?
We run pilot programs with a few manufacturing companies at a time. Tell us about your business and we will show what the colleagues can do with your documents and your data.